The foundation of resilient value chains
"*" indicates required fields
Faustine Delasalle
CEO Mission Possible Partnership
Executive Director Industrial Transition Accelerator
Economic resilience has moved to the top of the agenda for governments and businesses. Geopolitical tensions, trade fragmentation, energy shocks, supply chain disruptions and climate impacts are no longer marginal risks; they have become the norm – shaping prices and impacting economies in real time. While they rush to safeguard economies, businesses and livelihoods, political, corporate and finance leaders also need to address the structural vulnerabilities dramatically exposed by recurring crises.
The findings in this edition of Mission Possible Partnership’s Global Project Tracker should be
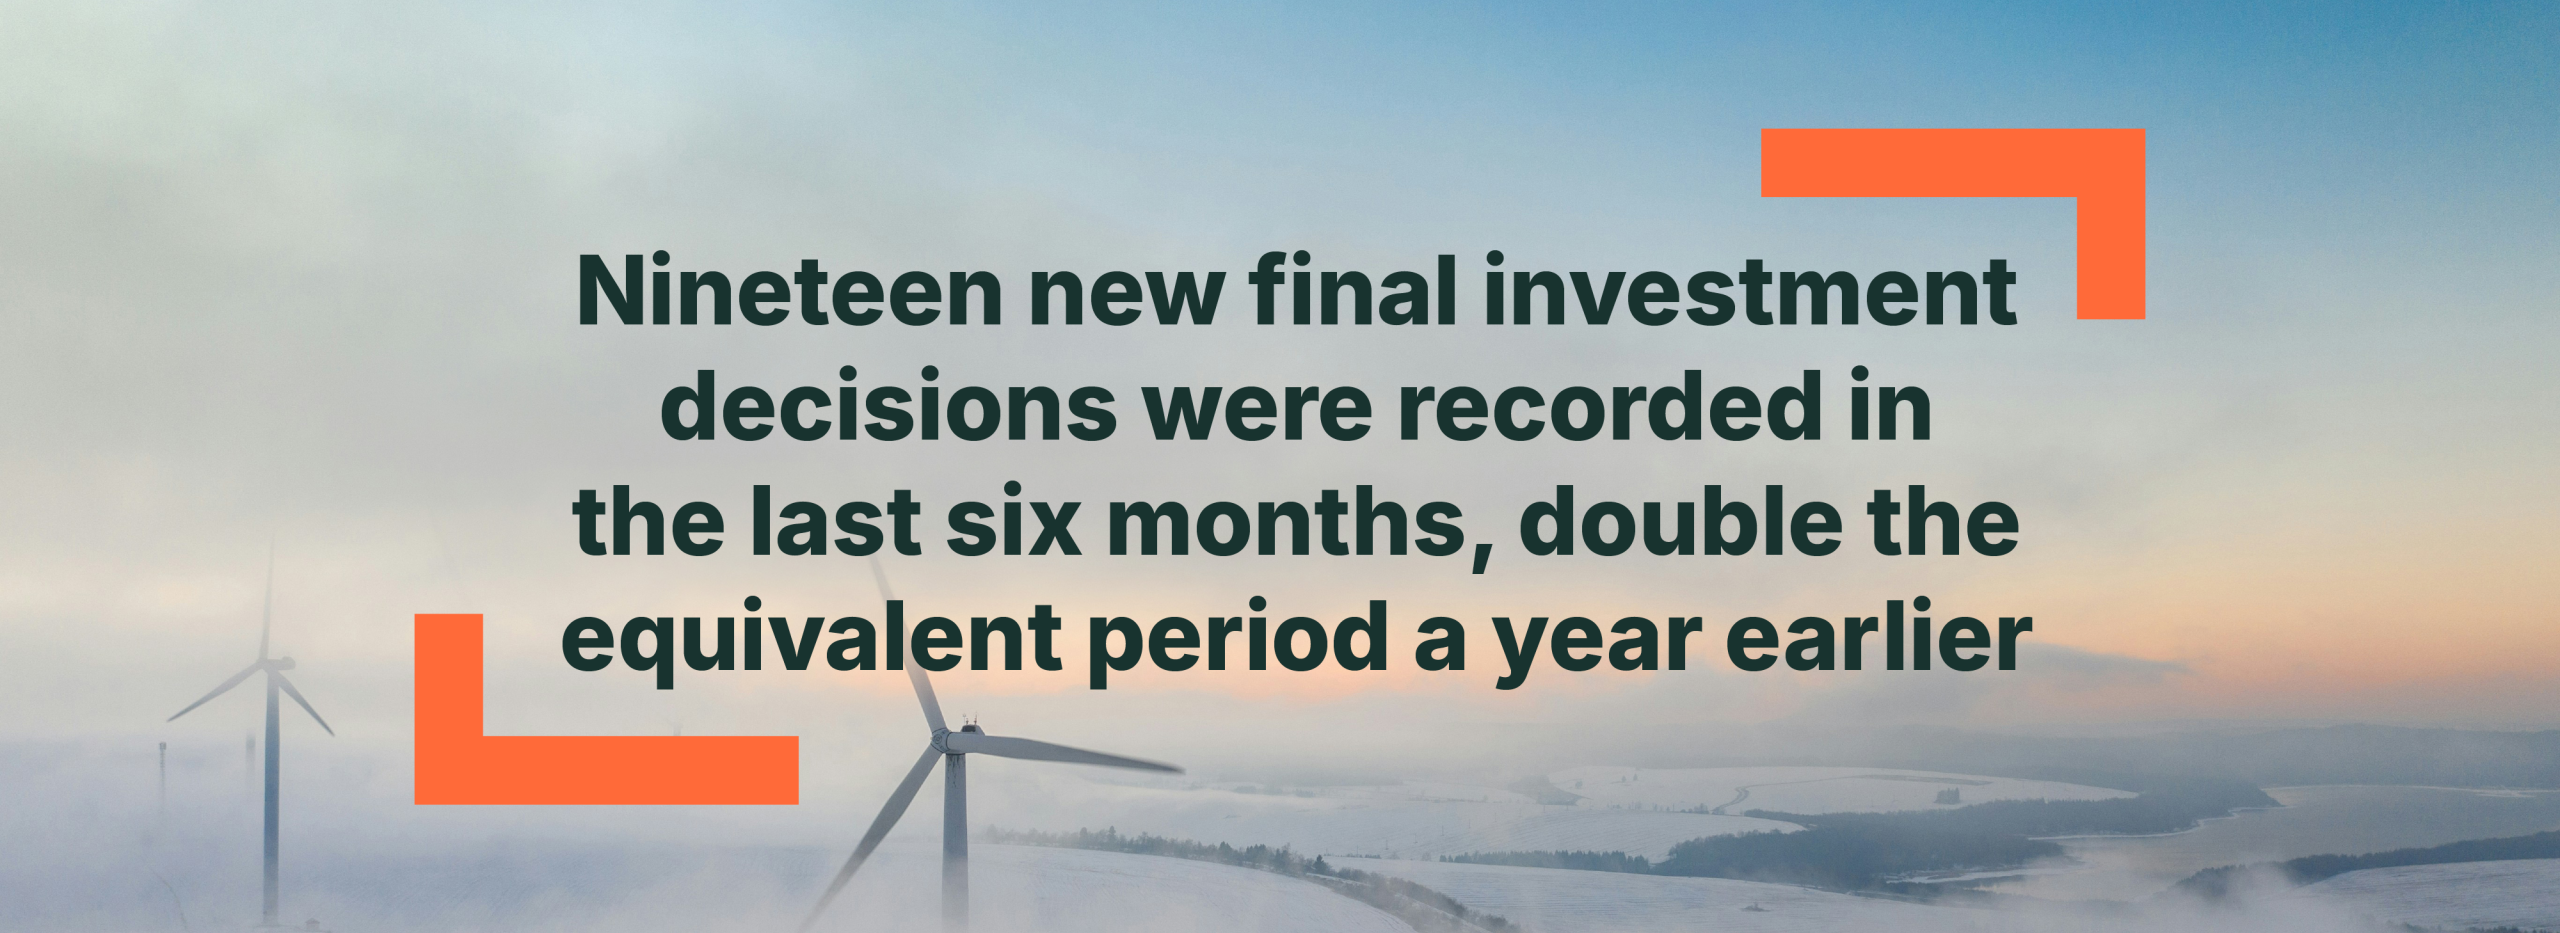
read in that context. Despite a more volatile global environment, clean industry investment has accelerated. 19 projects reached final investment decision in the last six months, over double the equivalent period a year earlier. And just outside of our reporting period, on 21st May, Acelen Renewables secured investment on their biorefinery to produce sustainable aviation fuel in Brazil, a project supported by the ITA.
This acceleration is happening because the strategic case for clean fuels, chemicals and materials is strengthening. Fossil fuel dependence is a structural vulnerability, exposing economies to price shocks, supply disruption, and inflation. These risks may not be priced appropriately yet, but they do influence national and corporate strategies and investments.
Low-to-no-emissions solutions for energy-intensive industries have long suffered from their so-called “green premium” against fossil fuel based production. This premium shrinks when prices of conventional products skyrocket and market volatility is priced in and it would disappear entirely if the long-term economic impacts of greenhouse gas emissions were appropriately priced. When geopolitical tensions, oil and gas market shocks and climate breakdown fuel high inflation, the cost of the transition to clean industry increasingly appears as a small, manageable and predictable insurance price against more disruptive forces.
China continues to forge ahead, concentrating 45% of commercial-scale, clean industry projects past final investment decision. The scale of its domestic market and the strategic coordination across entire value chains, underpinned by five-year plans, have enabled clean industrial technologies to move through deployment and into production at speed. That has consolidated China’s leadership not only in clean commodities production, but in the equipment and technologies that underpin clean industrial value chains.
Yet alongside China, a second group of clean industry leaders is emerging across the new industrial sunbelt: renewables-rich economies with the resource base to convert clean energy advantage into industrial competitiveness. India’s rapidly expanding pipeline, alongside first-of-a-kind projects such as ATOME’s Villeta pioneering green fertiliser plant in Paraguay, show how clean industry can serve domestic needs, reduce exposure to volatile imports, open new export markets and boost industrial growth.
For advanced industrial economies, the choices are more complex, but just as urgent. Clean industry cannot be built by ignoring Chinese technological leadership and the abundant, low-cost, clean energy potential of the emerging sunbelt – but cost competitiveness is no longer the sole objective of industrial strategies, and should be balanced with economic development, resilience and security imperatives. Governments need to decide where to build and protect domestic capability, where to partner internationally, with whom, and how to use the power of demand to strategically shape supply chains.
Markets are the linchpin of this transition. Without predictable demand for clean fuels, chemicals and materials, clean industry will not scale – no matter how many subsidies governments put on the table. With offtakes, announced projects can become bankable investments, assets under construction and value-creating plants. The rise of sustainable aviation fuels, where binding mandates are giving investors confidence in future revenues, is a powerful demonstration of the importance of demand-side policies. Markets determine which technologies scale, where production happens and who captures value.
First-of-a-kind and second-of-a-kind clean industrial plants attract the limelight, but successful first movers build entire value chains, from equipment, fuel, and feedstock supply to long-term offtakes across manufacturing sectors. Early trade and commercial relationships provide the foundations for scale. As clean fuels, chemicals and materials move towards industrial tipping points, countries and companies that act early win a lasting advantage.
Clean industry is rising. The question is who will shape it, build it, benefit from it and who will be left adapting to new value chains designed by others.
Industry provides the fuels, chemicals and materials that power our economies. Now, clean industry is emerging as a strategic advantage – strengthening supply chains, driving competitiveness, and unlocking the next wave of growth. Momentum is building – and the biggest gains come when technology, policy, capital and markets align.
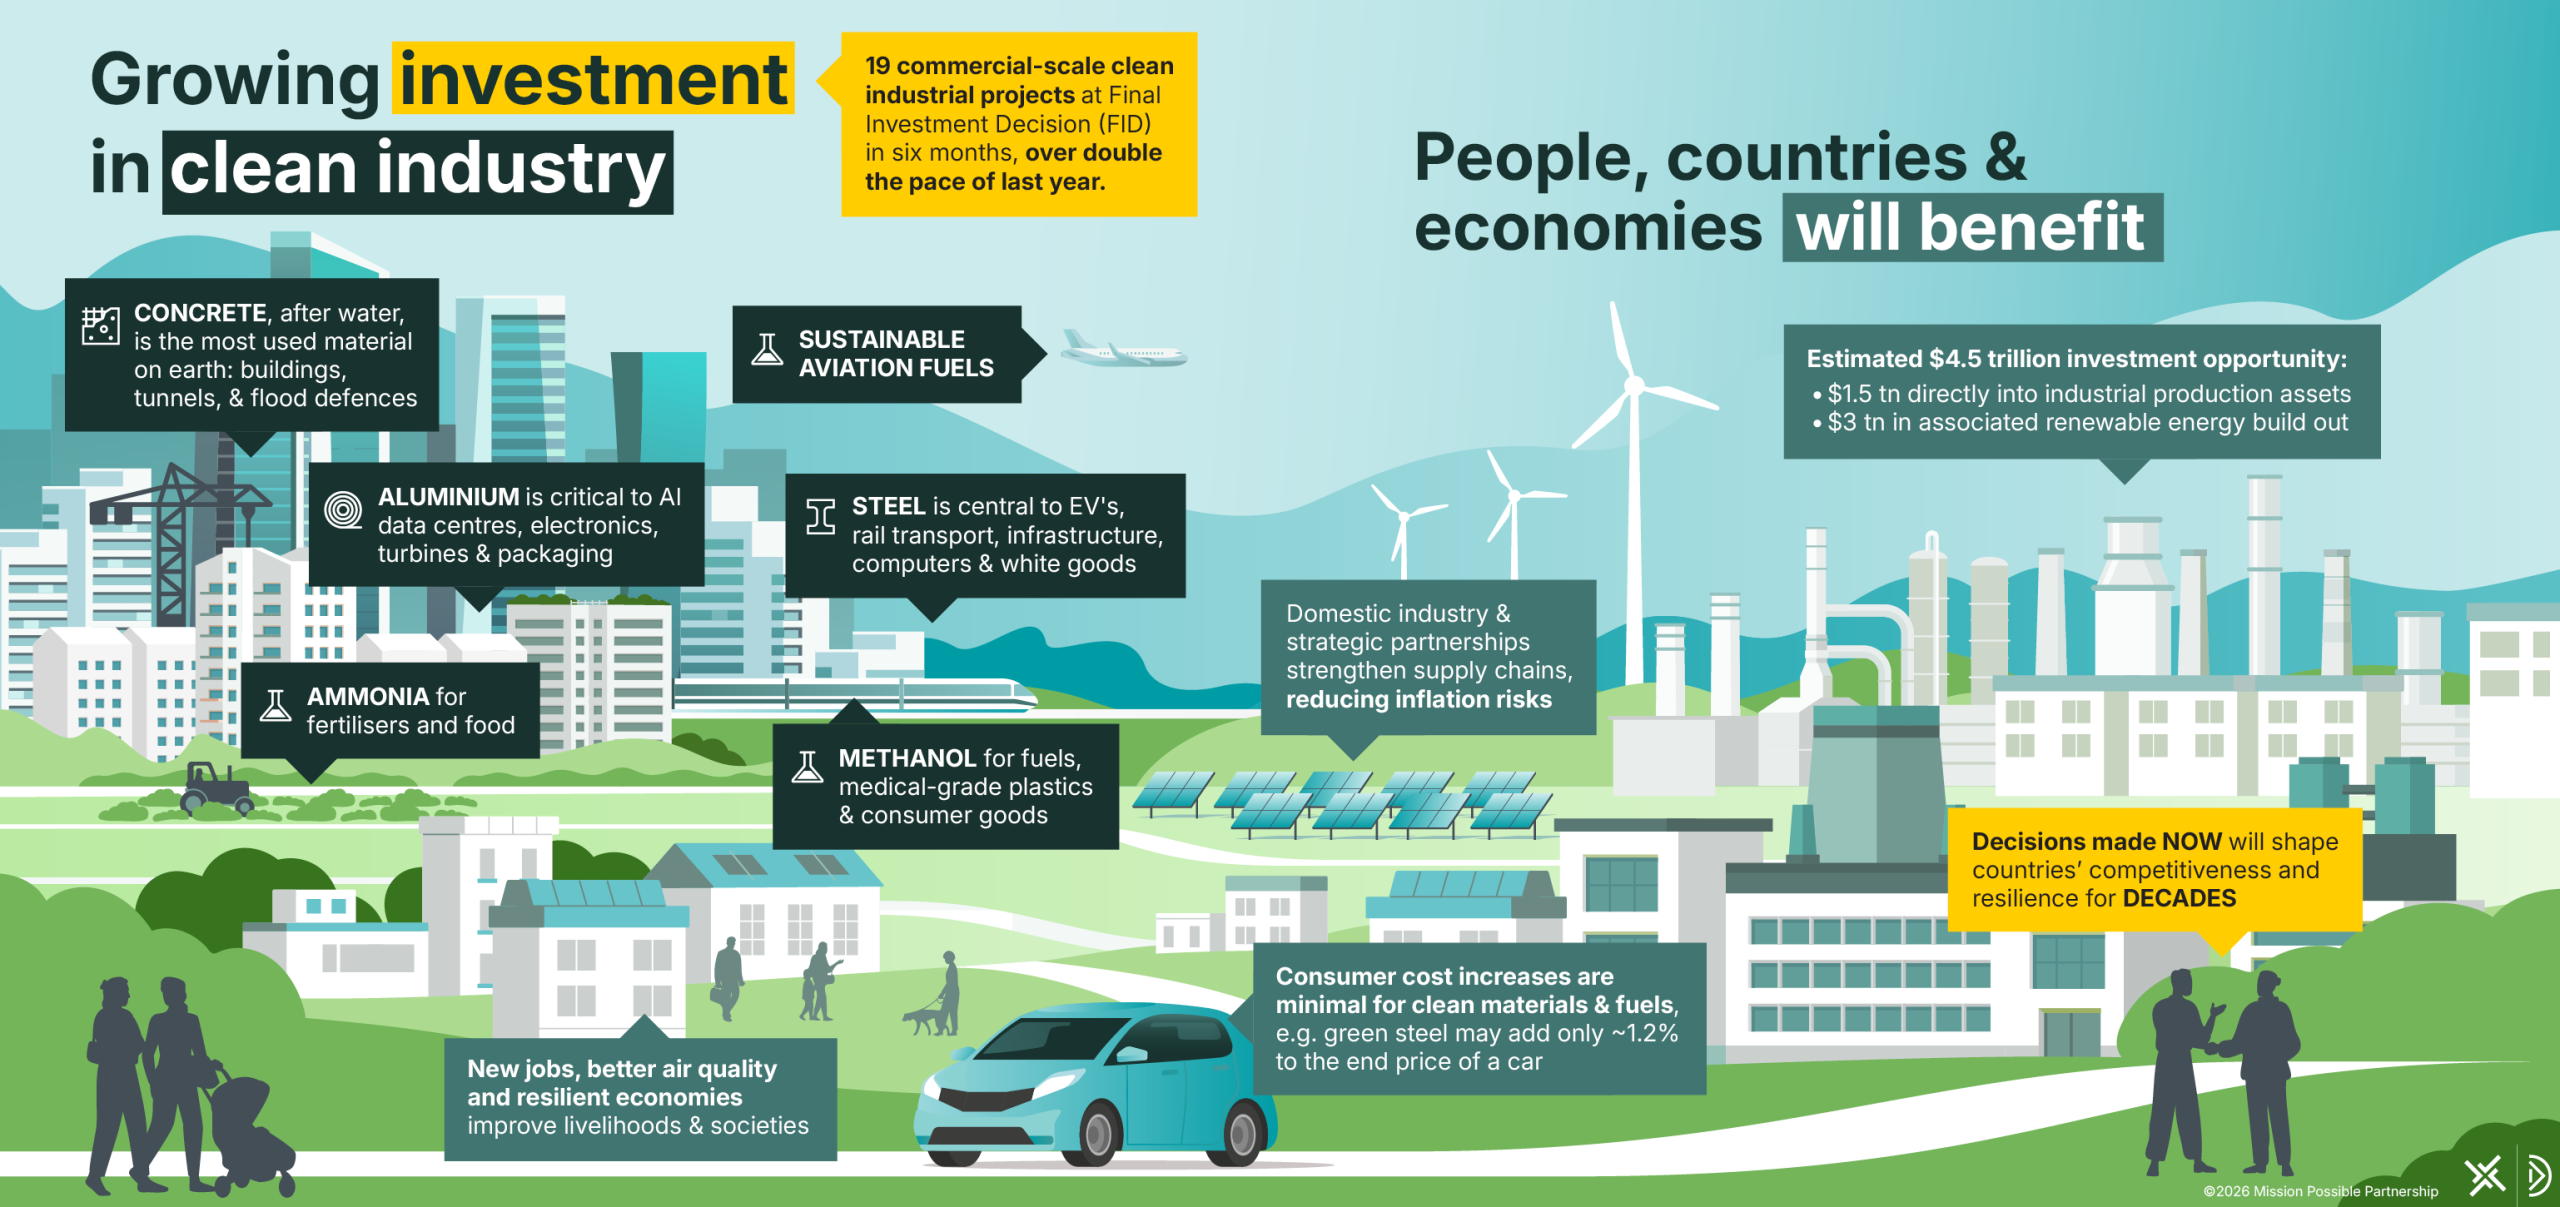
Energy is power and economic systems powered by fossil fuel energy are under pressure, now the cracks are showing. Despite these geopolitical and macroeconomic headwinds, investment into clean industry, powered by clean energy, has not slowed, in fact it has accelerated.
Nineteen new Final Investment Decisions (FIDs) were recorded in the last six months, over double the equivalent period a year earlier, putting 2026 on track to be the strongest year for clean industry investment to date. Across sectors, capital is being committed, not because conditions are easy, but because the strategic case has strengthened. Clean fuels, chemicals and materials, produced domestically or sourced from diverse, trusted partners, materially reduce exposure to fossil-fuel price shocks.
This fifth edition of the Global Project Tracker records 161 landmark clean industrial projects now in operation or being built, on top of the more than 800 in development worldwide. The global pipeline represents an estimated ~$4.7 tn investment opportunity: around $1.5tn directly into industrial production assets and around $3.2 tn in associated renewable energy build-out (renewables and batteries). Clean industry projects are not isolated assets. Each FID reached triggers demand for clean energy provision, infrastructure, equipment, pulls in technology suppliers, energy developers, commodity traders and financiers to serve clients close and far across interconnected value chains. Forward-looking countries are already positioning themselves to capture this opportunity across the full ecosystem, not just at the project level.
China remains the clearest demonstration of what strategically-coordinated industrial strategy can achieve, accounting for 45% of projects passed FID. Its strategy of sustained value chain scale-up is producing a steady stream of investment: 13 of the 19 new FIDs in the most recent period, confirming China’s high share of new FIDs over the past two years (>60%). Other economies have yet to match such scale and steadiness of progress. China’s maturing pipeline of projects is also enabling the country to solidify its clean technology leadership. China already provides >80% of the renewable energy equipment used directly by clean industry projects passed FID across the globe and, by serving its own pipeline, 45% of the clean industrial plant equipment. Europe and the US respectively seized 30% and <20% of the global clean industry equipment market to date.
The story for the coming period is what is building beyond China. India’s announced pipeline grew by 30% in just six months, making it the third-largest national pipeline globally by some distance. Countries across the New Industrial Sunbelt – from Brazil and Chile to Egypt, Oman and Australia – collectively hold 39% of announced projects worldwide, underpinned by renewable resource endowments that dwarf their domestic energy needs. These are competitive industrial economies with the resource base to produce clean commodities at globally advantageous cost and the strategic interest to do so.
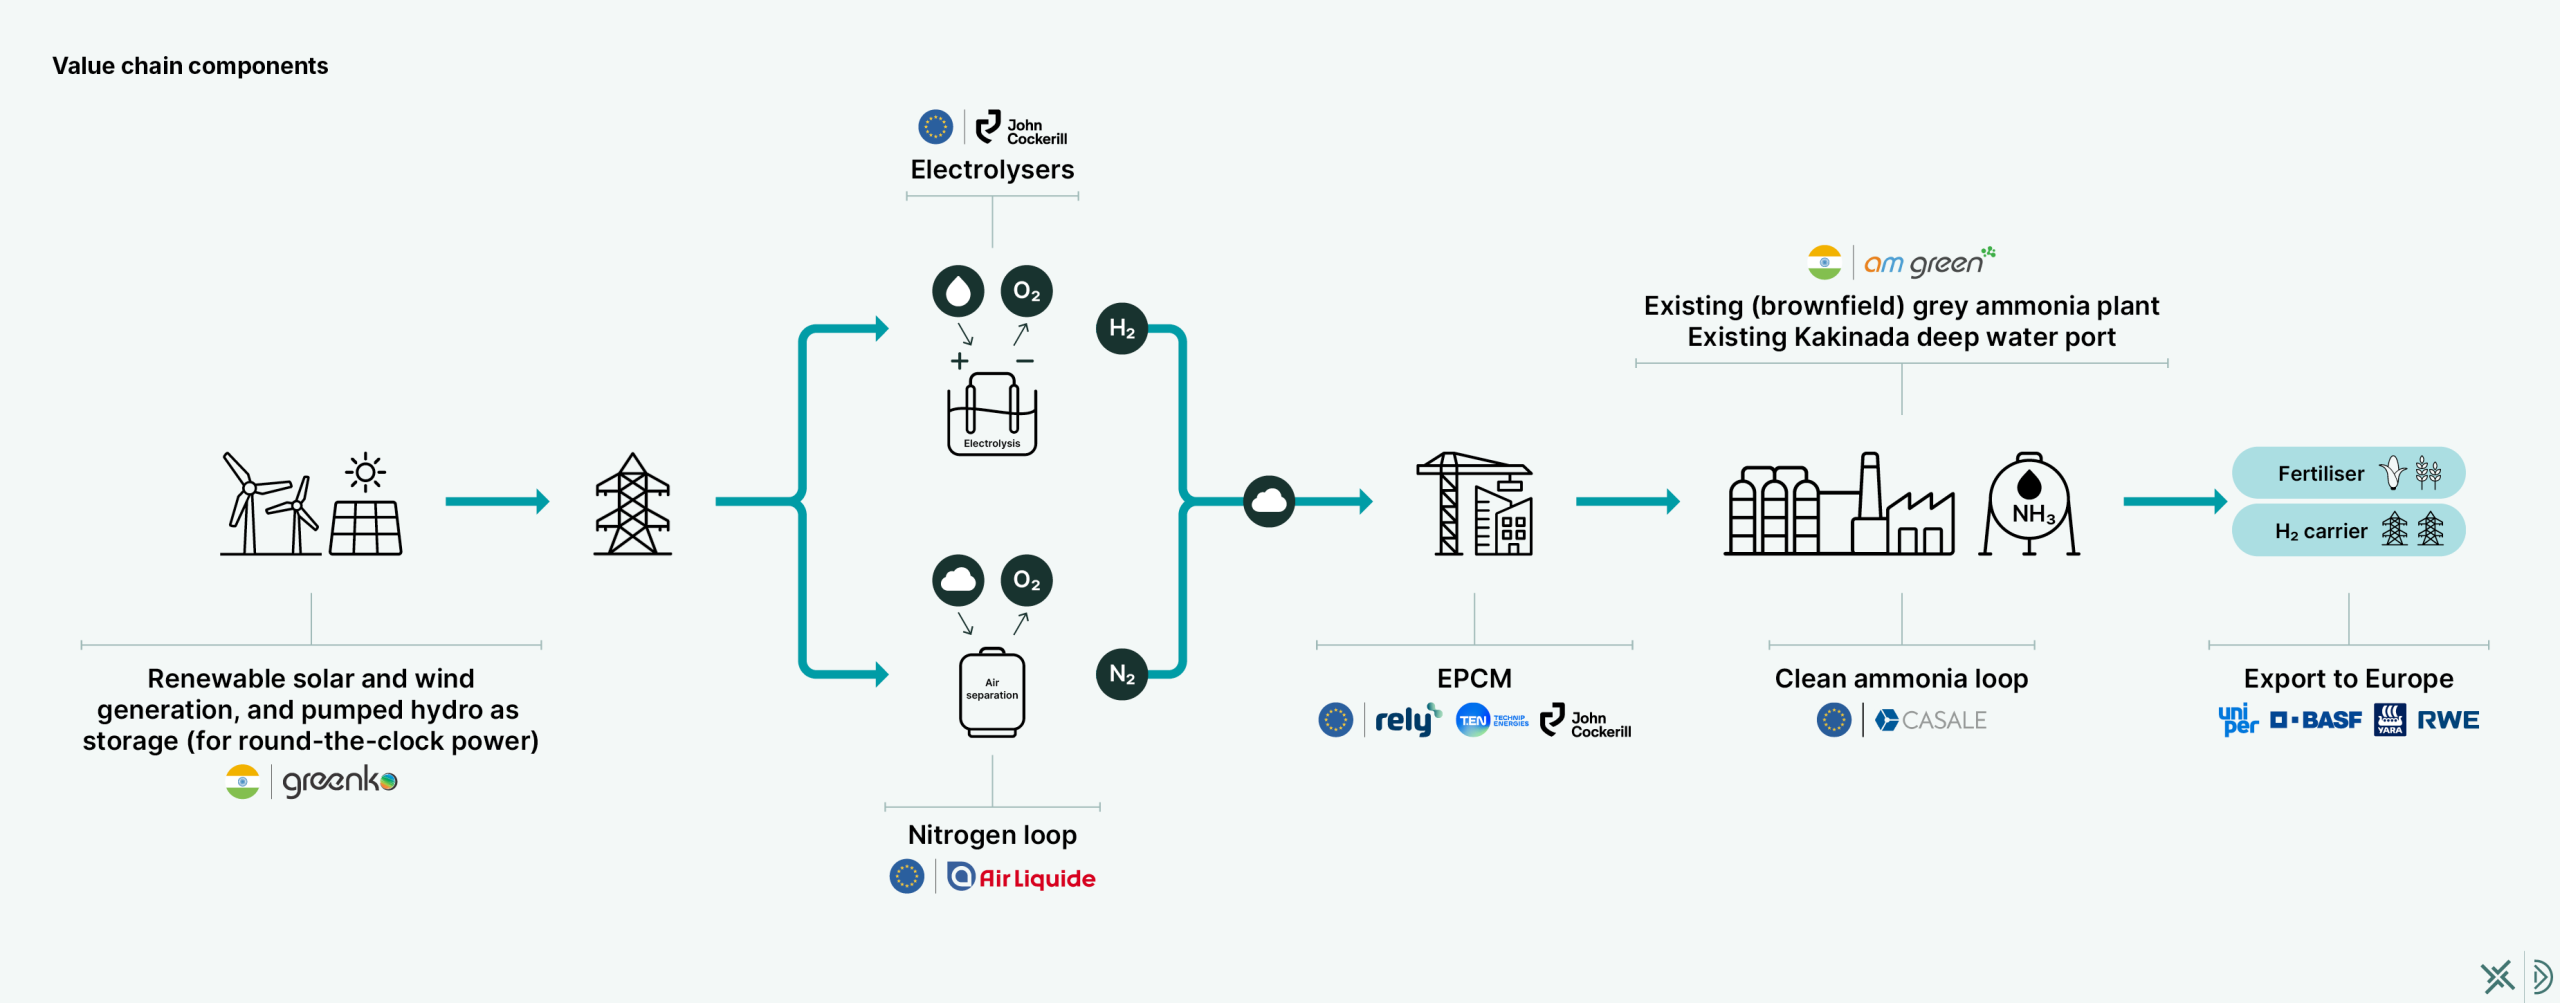
The strongest value chains will often be built across borders, not within them. The conditions that, combined, make clean industry most cost-competitive – low-cost renewable energy, best-in-class equipment, engineering expertise, and proximity to large end markets – rarely coexist within a single country. Sourcing clean iron from renewables-rich locations, for example, could halve the cost of clean steel for European consumers, while retaining >95% of European steel jobs and opening up markets abroad for European clean technology providers. Recent examples such as AM Green’s Kakinada project in India show that the projects reaching FID fastest are those that align favourable conditions through long-term cross-border partnerships.
The fuels sector is proving that policy can stimulate demand and convert a pipeline into investment reality. Aviation now has more clean industry projects passed FID than any other sector (except for legacy low-carbon aluminium assets), a reflection that binding long-term mandates are a clear market signal that converts future offtake into revenue confidence and removes the uncertainty that most often hinders a project’s bankability. The cumulative production capacity of projects passed FID has doubled since the EU’s ReFuelEU mandate was adopted in October 2023. Such momentum could be unlocked in other sectors if a small group of major economies simultaneously pursued the scale-up of lead markets for materials and chemicals.
Those who wait, or are forced to wait due to institutional or economic circumstances, will continue to be vulnerable to geopolitically-exposed supply chains and will eventually inherit the market terms others have set in new, clean industrial value chains.
The current energy system disruptions are not a blip, they are the start of shifting power dynamics and system-wide change. Countries that moved earliest to build domestic clean energy and early industrial capacity are now materially less exposed to the price shocks that have repeatedly destabilised fossil-dependent economies. Even if not by design, Spain’s conversion of its renewable endowment into clean energy advantage and now clean industry, is beginning to show greater resilience to global market shocks and to attract investment flows. The opportunities ahead across clean industry value chains remain vastly underappreciated. The technologies are proven, the business case is strengthening and costs are moving in the right direction.
We are at a strategic inflection point; the prize for those early movers extends beyond balance sheets and trade balances to the price of food on supermarket shelves and durable home-grown industry. The question for governments and companies is not whether to act, but how to leverage the clean industry revolution to protect and boost their economy and their citizens’ quality of life.
This report was led and prepared by Mission Possible Partnership (MPP). Learn more at www.missionpossiblepartnership.org. This report has been made possible with the support of QCF.
Lead authors: Faustine Delasalle, Sophie Meerstadt
Lead data analyst: Jennifer Qian
Contributors: Aman Poira, Anton Krimer, Can Li, Catherine McFarlane,
Clara Eldridge, Ed Boyd, Elliot Mari, Fabio Passaro, Pratheek Sripathy,
Vicki Harding
With special thanks to Atoma Research and Systemiq for their collaboration and to the developers who made the time to speak to us: AM Green, European Energy, IAG, LanzaJet, LanzaTech, Rely and Uniper.
Atoma Research is an independent climate technology analytics company combining AI-driven data acquisition with proprietary datasets to deliver deep insights across energy, aviation, shipping and carbon removal. Atoma works with us to find projects and project information.
Systemiq is a system change company working to scale sustainable economic systems. Systemiq works with us on high-value chemicals and provides support to the Global Project Tracker webpage.
Citation and rights
This work is © 2026 copyright Mission Possible Partnership. All rights reserved. Citation: “Mission Possible Partnership, Clean Industry rising: the foundation of resilient value chains, June 2026”. Adaptations should attribute: “This is an adaptation of Mission Possible Partnership, Clean Industry rising: the foundation of resilient value chains, June 2026”.
Data sources
Ammonia: Low-Emission Ammonia Data (LEAD): Plants (February 2026), © 2026 by Ammonia Energy Association is licensed under CC BY-NC-SA 4.0.
Methanol: E-Methanol, Biomethanol, and Low Carbon (blue) Methanol Plants (2026), Methanol Institute and Gena (2026) https://www.methanol.org/renewable/;
High Value Chemicals: Systemiq primary research; IEA Hydrogen
Production and Infrastructure Projects Database; IEA CCUS Projects Database; The Global Partners for Plastics Circularity Progress Tracker
Aviation: Atoma Research; MPP primary research
Aluminium: MPP primary research; International Aluminium Institute, Innovations in the Aluminium Industry (2025)
Steel: MPP primary research; Rocky Mountain Institute (RMI); CISRI; LeadIT. (2026). Green Steel Tracker. Leadership Group for Industry Transition. https://www.industrytransition.org/green-steel-tracker/
Cement: MPP primary research; Historical data from: Lorea, C; Sanchez, F; Torres-Morales, E. 2025. Green Cement Technology Tracker, Version May 2025 (05/2025) , Stockholm, Dataset, https://www.industrytransition.org/green-cement-technology-tracker
In a world where crisis has become the norm, import-dependent industrial supply chains are suffering, affecting growth and livelihoods
The vulnerability of fossil fuels importers
Since the industrial revolution, economies have been powered primarily by fossil fuels. Yet many countries lack sufficient domestic fossil resources for their energy needs. This leaves them structurally dependent on imports, particularly oil and gas.
Today, around 75% of the world’s population lives in countries that rely on imported fossil fuels to power their economies. For many, this dependence is acute: more than 60 countries import all of their oil, 89 import at least 80% , and 65 countries import all their gas, 83 import 80% or more.1
This high reliance on imported fossil fuels creates a persistent vulnerability: these economies are exposed to higher and more volatile energy costs, increased energy insecurity and poverty. This, in turn, can constrain economic growth, fuel inflation and impact livelihoods.
Dependencies across industrial value chains
Fossil fuel dependence extends well beyond direct energy use by individual consumers. Industrial value chains are deeply exposed to fossil inputs, both as fuels and as feedstocks.
Many economies depend on fossil fuel imports not only for transport fuels, essential to move people and goods, but also for the production of key materials such as the steel, cement and aluminium used in buildings, infrastructure and defence; chemicals used to produce plastics for medical supplies, packaging and consumer goods; and the fertilisers that underpin food production. Oil and gas market volatility and disruptions can interrupt these supply chains, undermine competitiveness, and even bring industrial production to a standstill.
In many regions, particularly across the Global South, dependence on imported fertilisers and imported gas to produce fertilisers locally further amplifies exposure to global energy markets, extending vulnerability into food systems and weakening food security.

1. Ember. “ Three facts that show how solar and wind strengthen energy security”, (April2025), Ember, The energy security fallout: from fossil fuel fragility to electric independence (March 2026). 2. Data focuses on dependence on imported fertiliser and natural gas when defining vulnerability index because coal-based ammonia productionis primarily concentrated in China, which has a vast domestic coal supply 3.MPP analysis based on IEA data; Estimated as Exposed Industrial Gas (EJ) = Total Gas Consumed (EJ) * Industrial Share % * Gas Import Dependency %; Estimation treats imported gas as proportionally distributed across all end-uses in the same ratio as total gas consumption. * Includes crude oil, NGLs, refinery feedstocks, additive/oxygenates (including biofuels) and other hydrocarbons (such as synthetic crude oil from oil sands) and petroleum products
Energy shocks are not isolated; they ripple across every sector of the economy
Energy crises are not isolated events
Since 2000, successive fossil energy shocks have translated into cost-of-living and industrial crises across the global economy. Oil and gas prices have been volatile for decades, with price spikes of 250-500% on a number of occasions. The COVID-19 crisis and Russia’s invasion of Ukraine triggered sharp energy price spikes with cascading impacts across electricity, transport, food and industry. Most recently, escalating conflict in the Middle East, beyond its human and economic consequences, has again highlighted how exposed many economies remain to fragile fossil fuel supply chains. These crises reflect structural vulnerabilities that fossil fuel dependence creates and that repeatedly resurface through the disruption to supply chains caused by geopolitical tensions.
Inflationary shocks disrupt livelihoods and supply chains
The recent conflict in the Middle East provides a stark example of the widespread inflationary shock of disruptions on oil and gas markets. Estimates of the likely impact on the global economy range from $300bn–$1.5tn.1 In just weeks, prices surged and supplies dried up, triggering price spikes across many industrial commodities, either directly because of higher cost of fuels and feedstocks, or indirectly because of higher electricity prices. The downstream effects are expected to persist for months; experts note that impacts on the fertiliser supply chain and on food prices could extend for years.2

1. “War darkens global economic outlook and reshapes policy priorities”, IMF, (Apr 2026). 2. “Chokepoint: How the War with Iran Threatens Global Food Security”, Center for Strategic and International Studies (CSIS), (Mar 2026) 3. “U.S. Crude Oil First Purchase Price”, EIA (Apr 2026) 4. “Henry Hub Natural Gas Spot Price”, EIA (Apr 2026); 5. Hot Rollled Coil used as proxy for crude steel price benchmark, calculated global price increase for period between Feb 2025, 2026 to April 30, 2026, source:”Hot Rolled Coil”, Trading Economics (Apr 26) 6. US based price increase of anhydrous ammonia cited for period between Feb 16 ,2026 to Apr,13 2026.: “Middle East Ceasefire Fails to Ease U.S. Fertilizer Price Pressure on Farmers“, Successful Farming (Apr 2026) 7. Calculated global urea price increase for period between Feb 25 2026 to April 30 2026; , source: “Urea”, Trading Econoomics (Apr 2026) 8. Calculated price increase of average jet fuel for major metropolitan cities in the US in period between Feb 25 2026 to April 30 2026, source: Argus U.S. Jet Fuel Index, Argus Media (Apr 2026)
Upfront costs to transform energy-intensive industries are high, but investments can be planned and ongoing operations are less than 1% of GDP1,2
Towards cleaner and more resilient supply chains
In a world of persistent disruption, it is just as critical that industrial supply chains are stable as that they are competitive. The fertiliser supply chain offers the most compelling example. In recent shocks, energy-driven disruptions have been linked to jumps in fertiliser production cost, leading to, for example, bread price increases of several percentage points (>3%), disproportionately affecting lower-income households in import-dependent economies. Climate impacts further amplify food insecurity by reducing yields and disrupting supplies. IPCC shows that climate impacts could increase global food prices by up to 84% by 2050,3 and that climate driven events are already causing widespread production losses and will heighten food system volatility.4
A progressive shift to green fertiliser production would raise prices modestly, at a controlled pace that can be designed to be manageable – starting with lower percentages of substitution today and increasing over time as prices comes down. This transition would both reduce the exposure of local food production to volatile global fossil fuel markets and contribute to reducing greenhouse gas emissions of a sector – fertiliser production – that currently represents 1-1.3% of global emissions.
Clean industry as a macroeconomic insurance
At the macroeconomic level, the contrast is even starker. Fossil energy crises and climate-related crises impose large, unplanned economic costs through spikes in inflation, fiscal pressure and deteriorating trade balances. Recent energy crises have generated trillions of dollars in economic damage, while climate impacts have reached over $2tn a year in recent years.
While the clean energy transition requires substantial investment (~$3.5tn per year), it has a fundamentally different cost profile. Investments can be planned and phased over time, rather than be unexpected and destabilising.5 Ongoing operational costs are concentrated in a limited set of industrial sectors, remain small relative to GDP (~0.5% of GDP), and will come down over time thanks to technology learnings and economies of scale.6

Sources: MPP analysis based on World Bank (2025), Business Analytiq, Argus, S&P, Czapp. Notes: 1. Assumed average exchange rate of 1 EUR = 1.08 USD; 2. Costs depend on the production location within Europe. Sweden and Spain have been used as examples here. 3. Porter, J. R., et al. Food security and food production systems Impacts, Adaptation and Vulnerability (WGII, Chapter 7, (2014); 4. IPCC. (2023). Climate Change 2023: Synthesis Report. Contribution of Working Groups I, II and III to the Sixth Assessment Report, used in MPP analysis to calculate impact on bread price. 5. McKinsey Global Institute. (2022). The net-zero transition: What it would cost, what it could bring. 6. ETC.(2020). Making Mission Possible: Dilivering a Net-Zero Economy 7. Figures shown on the graph are median values. Depending on the location, the production cost of green ammonia is estimated to be ± 25% today, ± 45% in 2030 and ± 45% in 2035. That range in green production cost translates into a range for the relative price of bread. For both 100% green ammonia use and partial green blending, bread price increase are given with a range of ± 35% for today, ± 70% in 2030 and ± 70% in 2035.

1. Projects include in-scope Category 1: Deep Decarbonisation projects only. For further definition on scoping please refer to methodology section; 2. HVC: High value chemicals include Olefins (Ethylene, Propylene, Butadiene), and Aromatics (Benzene, Toulene, Xylene). Source: MPP Global Project Tracker

The pipeline of projects is large and maturing
Clean industrial project pipelines now span every continent. The number of projects reaching Final Investment Decisions is accelerating – with a record 19 new FIDs between November ’25 and April ’26 – bringing the total number of projects passed FID to 161.
China continues to scale
Project data shows China is widening its lead, closing 13 FIDs in the last six months, compared with three in Europe and one in the US. It now concentrates 45% of projects passed FID. China’s emergence as an ‘electro-state’ is reflected in its industrial pipeline, dominated by both direct electrification and indirect electrification through hydrogen-based production routes; while use of locally available biomass also contributes to its strategy of energy diversification.
The Sunbelt can industrialise
At the same time, emerging countries that are part of the New Industrial Sunbelt, such as India, Brazil, Egypt and Chile, leverage strong renewable energy endowments to underpin growing clean industry project pipelines. This leaves them well placed to turn clean energy advantage into green industrialisation, reducing dependence on oil and gas imports across fuels, materials and food systems, while opening up new export opportunities. India has stepped up the pace, increasing its announced pipeline by 30% in the last six months.
Leadership is anchored in domestic renewable resources and diversified supply chains
A third of the global project pipeline is in the New Industrial Sunbelt, showing that clean industrial leadership is often grounded in access to low-cost, domestic renewables. Regions with more limited renewable scale-up potential, such as Europe, tend to pursue a more diversified portfolio of technology options – including electrification, hydrogen, biomass and carbon capture – underpinned by a mix of domestic energy resources and diversified imports.

1. 19 only represents the first half of the 2026 year. Projected number for Nov 25 – Oct 26 would be double assuming a consistent rate. * Note that given updates in the pipeline figures and methodology, comparisons against the previous Tracker are not directly made. Pipeline changes include newly sourced data, project pauses and cancellations. For full methodology, see Appendix. Source: MPP Global Project Tracker
Fuels and chemicals continue to lead project and investment momentum. Out of the 19 new FIDs delivered in the past six months, 16 were in the fuels and chemicals sectors: nine methanol,
four sustainable aviation fuel and three ammonia projects.
The ammonia pipeline alone covers about 1.5x global ammonia demand (including IMO projected shipping demand by 2030). Methanol projects cover roughly 50% of demand (also including shipping projections). Importantly, projects passed FID will soon cover nearly 5% of global demand in both sectors.
Materials sectors are slower to progress.
Only one steel and two aluminium FIDs are recorded in the first part of 2026, all in China. Aluminium stands apart because many legacy smelters are already powered by hydropower, giving it a head start on low-carbon production. However, the sector has seen limited shifts from grey to green in recent years outside of China. Beyond aluminium, clean steel and cement projects that have reached FID represent only ~1% or less of current grey demand. And at this stage of the transition, even modest additions to clean steel and cement volumes could unlock technology learning and cost reductions.

China is moving fast.
China accounts for 21% of the total global clean-industry pipeline – a number likely underestimated due to lack of visibility on early-stage projects compared to other geographies – and 45% of projects passed FID, reflecting sustained scale-up across fuels, chemicals and materials. Since November, China has unlocked 13 of the 19 new global FIDs, representing >60% of all FIDs reached in the last six months, a similar share as for FIDs achieved in 2024 and 2025. Pipeline momentum and recent FID activity indicate continued acceleration in the new clean economy as China positions itself for global leadership.
Europe is showing progress, but conversion remains slower.
Representing 26% of the total global pipeline and 24% of passed-FID capacity, Europe saw three new FIDs in the past six months, equivalent to 16% of recent global investments. All these new FIDs were concentrated in the aviation sector, which benefits from the EU’s blending mandate driving predictable demand for Sustainable Aviation Fuels.
The New Industrial Sunbelt has superb potential to scale, but FIDs remain limited.
Renewables-rich Sunbelt countries account for 39% of the total global pipeline, yet only 12% of projects passed FID. So far in 2026, two FIDs have been unlocked – two ammonia projects in Thailand and Paraguay – equivalent to 11% of recent global FIDs. These countries’ energy advantages will only translate into new clean industries if they can convert their promising pipelines into realised investments.
Project financing in the United States is losing momentum.
The United States has a significant pipeline, but is losing relative momentum. Its pipeline of announced projects has dropped from 92 to 72 in the past 12 months. The US holds 9% of the global pipeline and represents 7% of projects passed FID and only one new FID in the last six months.

Governments are leveraging the development of clean industry to pursue diverse strategic objectives, including domestic resilience and economic diversification, depending on their fossil fuel exposure. Among the top 20 clean industry leaders by size of pipeline, examples include:

Governments are leveraging the development of clean industry to pursue diverse strategic objectives, including domestic resilience and economic diversification, depending on their fossil fuel exposure. Among the top 20 clean industry leaders by size of pipeline, examples include:

1. The United States is net importer of crude oil while still being a net exporter of refiner products since many of its refineries are built to process heavy crude as opposed to lighter crude produced within the country. The US also imports small amounts of coal due to chemical and physical properties of coal needed for end users such as steel 2. Australia is a peculiarity due to its high dependency on imports for refined products even if it’s a net oil (light crude) exporter due to a lack of refining capacity and lack of heavy crude required for fuel production; Source: MPP Global Project Tracker; IEA, World Energy Balances, (2023); * Oil defined as crude oil, NGLs, refinery feedstocks, additive/oxygenates (including biofuels) and other hydrocarbons (such as synthetic crude oil from oil sands)
Countries of the New Industrial Sunbelt predominantly pursue direct and indirect electrification projects, with green hydrogen representing 86% of their projects. This reflects their strong competitive advantage when it comes to providing abundant, cheap, clean electricity to energy-intensive industrial players.
China is similarly curbing its dependence on fossil fuels by doubling down on direct and indirect electrification (hydrogen representing 69% of known projects) alongside some use of biomass (21%) for further diversification.
Developed economies that are currently net fossil fuel importers pursue a more diversified portfolio. Hydrogen-based projects dominate their pipeline (62% of projects). Such projects would enable these countries to reduce dependence on volatile fossil fuels while likely being served by a mix of domestic hydrogen production and diversified imports. Hydrogen-based projects are complemented by projects using biomass and waste (24%) and carbon capture (13%).
Developed economies that are fossil fuel producers also pursue a diversified portfolio, but with a higher share of carbon capture projects (17%) leveraging their preexisting fossil fuel value chain. These countries also have a higher share of direct electrification projects (14%) compared to other developed economies, reflecting their additional natural endowments: solar in Australia, hydropower in countries such as Canada, Russia, or Norway, which hold a significant share of legacy low-carbon aluminium smelters and a diverse renewable energy mix in the United States.

1. New Industrial Sunbelt regions include: SE Asia, India, Brazil, MENAT, LatAm. Sub-Saharan Africa and Other Asia (Pakistan, Uzbekistan, Kazakhstan) 2. Developed Fossil Fuel Importers include EU, UK, Iceland, Ukraine, Japan and South Korea. 3. Developed Fossil Fuel Producers include the US, Canada, Russia, Australia and Norway. Source: MPP Global Project Tracker


1. Kleinschmidt, ATOME reaches FID for Villeta Green Fertilizer Project, World Fertilizer (2026), image source: 145MW Villeta – ATOME – The Commodities Of The Future, Today 2. SkyNRG announces Financial Close and starts construction on its first Sustainable Aviation Fuel plant DSL-01 in Delfzijl the Netherlands, SkyNRG (2026); 3. Goldwind Technology’s Green Methanol Production Project Officially Launched, Seetao (2024). Source: MPP Global Project Tracker, Developer interviews
Case Study | LanzaJet
For the aviation sector, the transition to sustainable fuels is just getting started, but it is one of the areas where progress is fastest, with eight projects reaching FID in the past 18 months.
The current project pipeline offers a vast market for technology providers
The global pipeline of announced projects represents an estimated $4.7 trillion1. This represents a significant market opportunity for developers and technology suppliers. This amount encompasses around $1.5 trillion in plant-level equipment and industrial assets and around $3.2 trillion in associated renewable energy build-out (renewables and batteries).
The opportunity spans multiple technology stacks
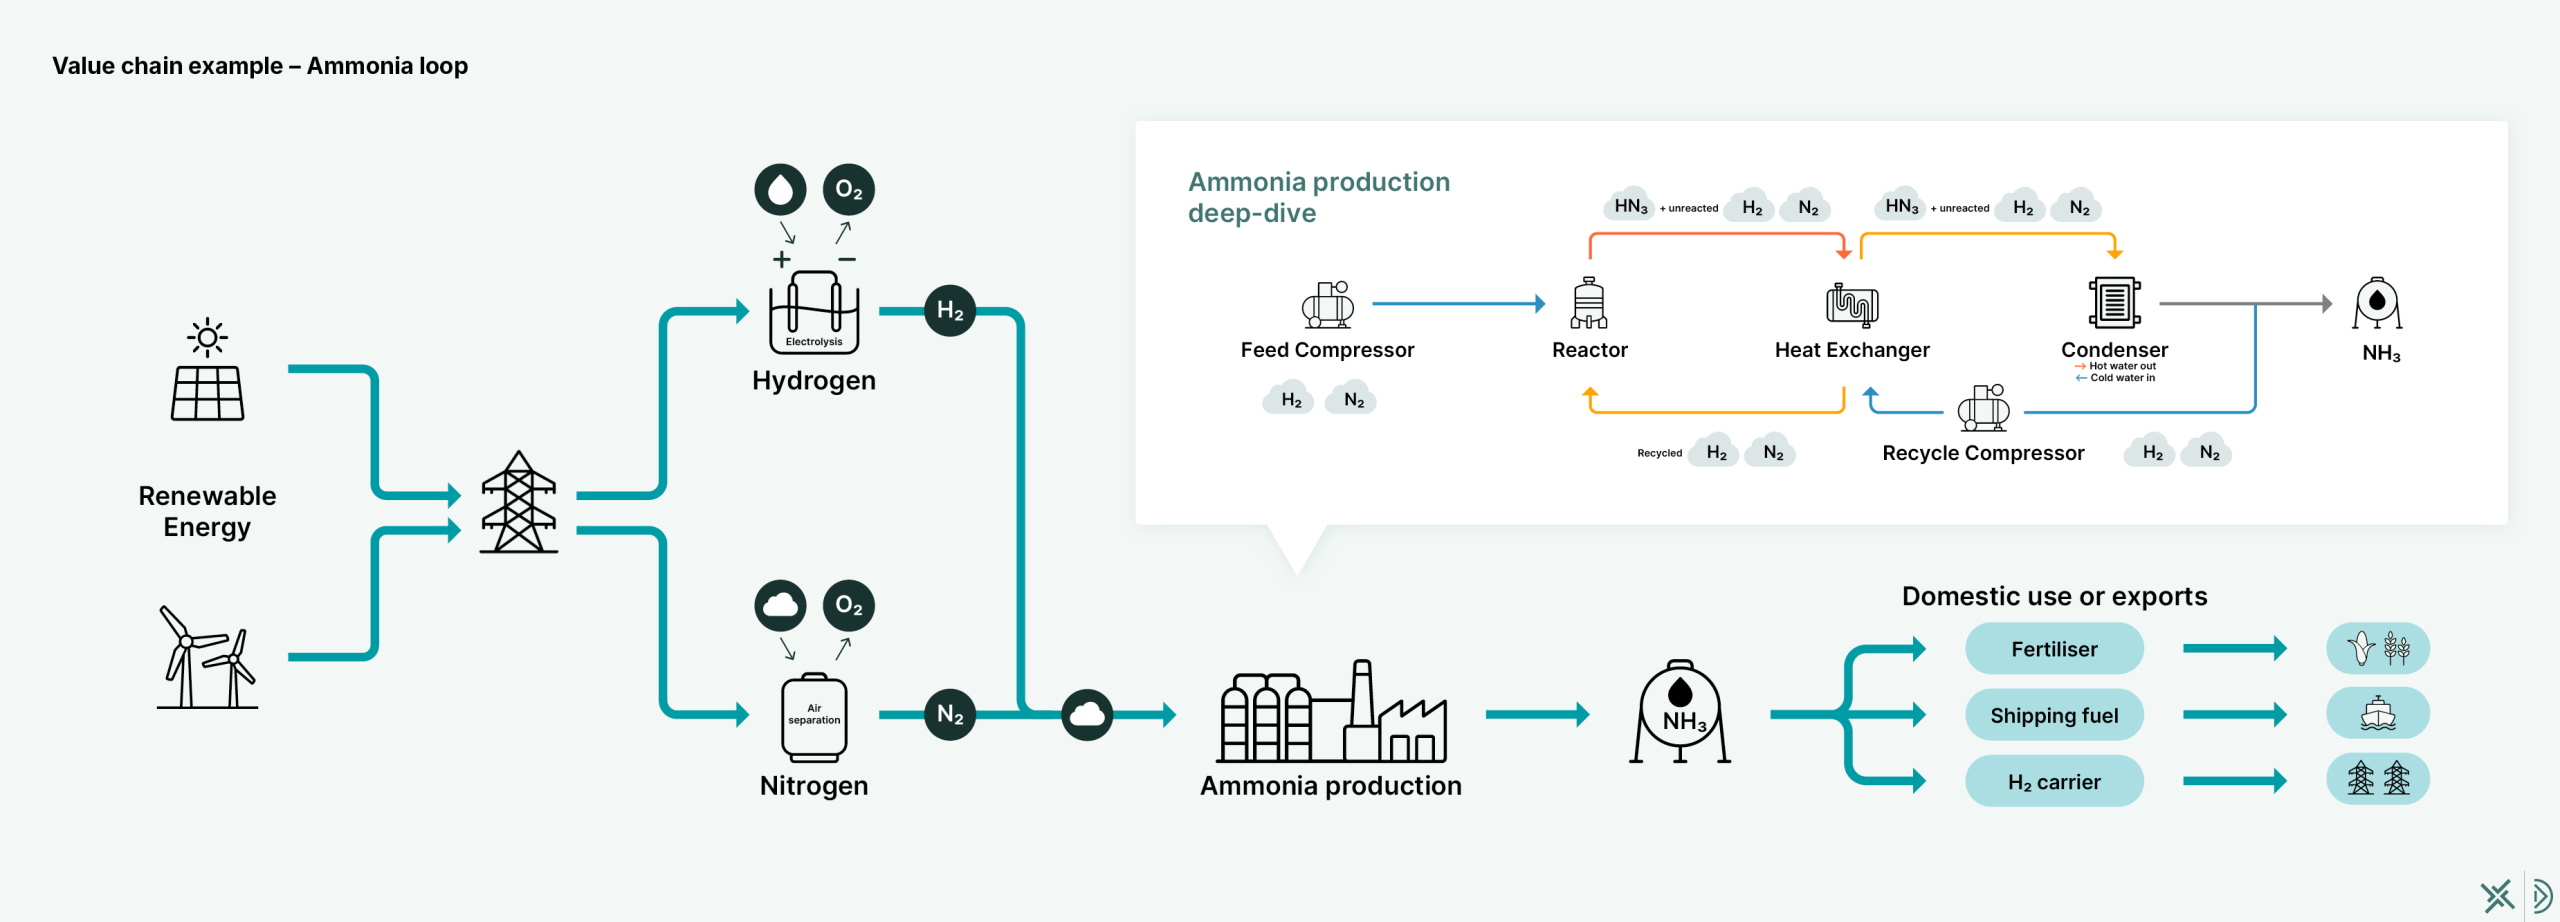
Renewables, batteries and electrolysers will be core enabling technologies for industry’s clean transition because of hydrogen’s prevalence in the global pipeline. Together, these segments represent the largest share of the opportunity for clean technology providers, with a further ~$750 billion set to be invested across complementary technologies, including carbon capture and sector-specific equipment such as ammonia loops, furnaces for direct iron reduction, or catalysts for fuel refining.
The clean industry technology race is already under way – but not decided
China has built substantial scale in mature clean tech manufacturing, accounting for more than 70% of global clean tech production across solar PV, wind, batteries and EVs. This is reflected in China’s overwhelming majority share of renewable equipment provision to clean industrial projects that have already reached FID (83%).
The market for clean industry technologies remains more open and competitive: China is leading because it serves its domestic pipeline, which concentrates 45% of projects passed FID globally, followed by Europe (~30% market share) and the United States (~20%). For clean industry technology providers, acting now to commercialise these technologies at scale is key to improve performance and drive down costs, locking in lasting competitive advantages and building export-ready industries.
1. Investment figures in this section based on top down estimated capex for key tech pathways and high level regional extrapolations
The pipeline of projects that have not yet reached FID represents an investment potential of ~$4.7 trillion, comprising production assets and the renewable energy capacity required to supply them. Renewable energy accounts for two-thirds of this total investment opportunity.
Ammonia dominates total investment potential, reflecting both the large size of the production assets and the high clean power requirements associated with them. Aviation and methanol follow – at a distance.

The scale of the future opportunity in renewable build-out associated with clean industry is explained by the dominance of hydrogen-based projects in the announced pipeline. In the ammonia sector, green ammonia projects based on electrolysis represent ~90% of the projects, while the pipeline of projects using carbon capture on gas-based ammonia production remains limited. In sectors like methanol and steel, where a variety of technology options could be considered to produce low-carbon products, hydrogen dominates, representing ~75% of the total project pipeline in both sectors.


Source: MPP Global Project Tracker, MPP analysis

1. Besides electrolysis technology as shown on previous page. Source: MPP Global Project Tracker, MPP analysis

1. Methodology to calculate flows: equipment costs were aggregated across the markets. The cost of the equipment required for each individual project was estimated using techno-economic models specific to each deployed technology. Origin of the supplied equipment was identified based on available publications and public announcements. Where specific OEMs were not announced, the most likely suppliers were derived from available market information, e.g. announcements on similar projects.The required renewable energy (RE) capacity, including solar, wind and battery storage, was estimated based on renewable energy capacity factors specific to the project location/region. The cost of RE systems was estimated using the Annual Technology Baseline 2024, which was developed by the National Laboratory of the Rockies.

1. Methodology to calculate flows: equipment costs were aggregated across the markets. The cost of the equipment required for each individual project was estimated using techno-economic models specific to each deployed technology. Origin of the supplied equipment was identified based on available publications and public announcements. Where specific OEMs were not announced, the most likely suppliers were derived from available market information, e.g. announcements on similar projects.
Case Study | CISRI Linyi
Pioneering pure-hydrogen metallurgy
Case Study | European Energy Kassø
Building the world’s first e-methanol plant
Buyers choose what they buy and from where
The largest consumers of materials like steel, chemicals such as ammonia and fuels such as sustainable aviation fuels, sit at the top of global supply chains. In a world of growing trade fragmentation, they can decide through their market and trade policies what is produced domestically versus what is imported and from where. China, India, Europe and the US are the most prominent markets for industrial commodities today; they shape current markets and can configure the new supply chains of clean commodities. They can build resilience into their economies – making strategic choices that balance near-term cost, long-term competitiveness, jobs and resilience to geopolitical and climate shocks.
Demand-stimulation policies: the key to shaping new markets
Demand only shapes supply when it is credible and investable. Policies stimulating demand for low-carbon commodities are critical to unlock investment in supply and shape that supply in line with national strategic interests. Project data shows that where demand-stimulation policies are weak or absent, pipelines stall; where they exist, investment follows. Aviation – supported by blending mandates – now has the highest number of clean-industry projects past FID (46) (excluding legacy aluminium). The next sector is methanol – with 24 projects passed FID – boosted by mandates in China. The pioneering EU aviation mandate demonstrates the power of buyers: the sustainability criteria imposed by the EU are influencing which projects move forward across the globe, forcing SAF project developers to prioritise feedstocks that will be compliant with EU regulations.
Scale is the catalyst to unlock exponential growth
The deployment of new technologies usually follows a S-curve, with slow progress until a tipping point is reached, reinforcing feedback loops – such as cost declines, market uptake, policy support and infrastructure build out – kick in and deployment becomes exponential and selfsustaining. If they start scaling their domestic market for low-carbon commodities simultaneously, a small group of major economies could together precipitate clean commodity tipping points, unleashing the clean industrial revolution.
Countries with the biggest demand pull for materials, chemicals and fuels today have the power to influence how the clean industry transformation unfolds in these value chains. Through their market and trade policies, they can influence the location of clean production, which clean technologies are used, which technology suppliers serve these new markets and where value accrues.
Today, demand power sits with a small number of large markets. China, Europe, the United States, India and a handful of other major economies currently account for the majority of industrial commodity demand. Major importers of manufactured goods, such as Europe and the United States, can also influence the decisions of consumer goods companies in countries like China that supply their markets.
That balance will shift as emerging markets grow. Fast-growing economies in South-East Asia and parts of Africa are expected to account for an increasing share of demand over the next decade, expanding their ability to shape their own supply chains.

Investment is unlocked when revenues become more certain.
Across sectors, project evidence shows the necessary first step to secure finance is predictable offtake agreements at a price affordable to both the developers and offtakers. Today’s clean commodity markets remain too small and uncertain to unlock the pipeline at scale.
If they want to shape new global supply chains, countries with the biggest markets for fuels, chemicals and materials need to first create demand for clean commodities. Market creation policies – such as green public procurement, mandates on private procurement and carbon pricing mechanisms – are essential to create investable revenue streams.
Evidence from the project pipeline shows that where predictable signals exist, most clearly in sustainable aviation fuels and in methanol and where they are expected, in ammonia and methanol as zero-carbon shipping fuels, the pipeline grows and investors respond. In materials production, where the pipeline lags behind, the metals and cement sectors stand to benefit from strengthened market-stimulation policies. Mandates, quotas, clean procurement rules and pricing mechanisms are not peripheral instruments, but the precondition for unlocking investment at pace.

Mandates are translating demand certainty into FIDs
Sustainable aviation fuel mandates have emerged as the most effective lever for scaling SAF production. The EU’s ReFuelEU Aviation mandate – requiring SAF blending to rise from 2% in 2025 to 6% by 2030 and 70% by 2050 – has created predictable, binding demand that has translated directly into project investment in Europe and across the globe in countries with favourable natural endowments for biofuels production.
Since the mandate’s adoption in October 2023, projects reaching FID have increased sharply, with cumulative past-FID capacity more than doubling, demonstrating a clear supply-side response to regulated demand, tracking the timeline set out by the EU and enabling targets to be met.
Aviation shows how policy design can unlock investment at scale
Sustainable aviation fuel mandates are now spreading in application from Europe to Asia. As a result, over the past two years, aviation accounted for 35% of all clean-industry projects reaching FID and overall the sector has the most projects at investment globally (excluding legacy aluminium projects) with 46 passed FID, including 22 that are operational. A further 55 SAF projects excluded from the Global Project Tracker’s deep decarbonisation projects have generation 1 (or unclearly defined) feedstocks1. This concentration underscores how binding, long-term mandates reduce demand risk, enabling revenue certainty through offtake agreements, an often-decisive factor in reaching investment.
What’s happening in aviation highlights the power of mandates to provide clarity of a phased, predictable ramp up, enforcement and a clear rulebook. Where these elements are present, clean commodity markets can scale and are particularly effective where technology-push or voluntary approaches alone fail to underpin more than first or second-of-a-kind investments.
First buyers shape global markets
The pioneering EU aviation mandate also demonstrates the power of buyers to shape the technical qualifications of new supply chains: the criteria imposed by the EU are influencing which projects move forward across the globe, forcing SAF project developers to prioritise feedstocks that will be compliant with EU regulations.

1. These projects with generation 1 or unclearly defined feedstocks no longer have the Critical decarbonisation technologies categorisation, but are still separately counted and included in the First big steps technologies category. See slide in appendix titled Category Definitions for further reference. 2. MPP Global Project Tracker (June 2026); RMI, Global SAF Demand (Oct 2024)


The strategic choices facing the German steel industry illustrate this difficult balancing act. German fossil-based steel production, vulnerable to peaks in gas prices that set electricity prices, currently struggles to compete in a global market suffering from overcapacity. The shift to clean steel, incentivised by the EU’s carbon pricing mechanism, will modernise and future-proof the sector, but represents upfront investments and an ongoing green premium for industrial players. Importantly, two different value chain configurations could be considered:
The choices made by the EU and Germany today in their carbon pricing, industry and trade policies will strongly influence the balance between these two paths going forward, the shape of the future European steel industry and the scale of the opportunity for aspiring green iron producers around the world.

Sources: MPP analysis based on J.C. Kelly et al. (2020), S. Xiong et al. (2019), RMIS (2025), R&D GREET 2 Series Vehicle-Cycle, ADEME (2024), BCG (2023), ICCT (2025), IEAGHG (2013), TradeMap, Steelonthenet (2025), N. Müllet et al. (2021), K. Benavides et al. (2024), X. Fang et al. (2024), P. Cavaliere et al. (2022), A. Bhaskar et al. (2020), L. Hooey et al. (2014), W. Hall et al. (2021), P. Duarte & J. Martinez (2021), BNEF (2025), Eurostat (2025), Eurostat (2026), World Steel (2025) and other publicly available sources.
1. Selected vehicle is an average compact ICE. Anaylsis with other vehicle types lead to similar conclusions. 2. Assumes net power demand (i.e. minus self-generation from process gases) of 380 kWh/tsteel for the BF-BOF route, 2,900 kWh/tDRI for H2-DRI, 600 kWh/tsteel for the EAF and 3,800 kWh/tsteel for the integrated H2-DRI-EAF route.
No single instrument can simultaneously deliver rapid decarbonisation, low costs, resilience and jobs creation all at once. In practise, a three-pronged approach is logical:
Focus supply-side support where it matters most – target subsidies and industrial support towards segments that you want to anchor domestically, especially where jobs and value are concentrated and where capability delivers resilience or strategic advantage (e.g. high value processing, finishing, specialised production);
Design demand-side policies to scale markets and source as you see fit, using procurement rules and content requirements to direct buying power toward the suppliers and geographies that serve your resilience and industrial goals; and
Develop trade partnerships in service of affordability and resilience, where domestic supply is neither cost-competitive nor strategically essential, securing reliable, low-cost inputs through diversified supply chains.
Target local content rules where they matter most and can build advantage
When designing demand-stimulation policies, governments should be clear on what they want to produce domestically, what they want to import and from whom, to shape the markets in line with their strategic needs:
If cost is paramount, in the absence of any other strategic consideration, free trade remains the most evident and easily applicable option, ensuring cost to downstream sectors and to consumers are as low as possible.
If there is a risk of overly concentrated supply and a strategic imperative to diversify supply from trusted partners, a country could grant preferential access to its domestic market to a subset of trade partners based on considerations such as effective implementation of carbon pricing and reciprocity of market access – this is an option currently considered in the EU’s Industrial Accelerator Act.
In sectors where a country has already established an undisputable clean industrial leadership, opening access to its domestic market can open the doors of international trade to national leaders.
When economic or geopolitical priorities justify a level of domestic production despite higher costs, governments can use targeted local content rules (e.g. “Made in Europe”) to build a domestic value chain. Over time, this can become cost competitive or help protect strategically important parts of the chain
Embed other strategic goals in industrial policy design
Countries can also leverage their industrial policy frameworks to pursue distinctive strategic goals, for instance:
Expanding global markets for clean commodities to level the playing field and open new market opportunities for national champions – e.g., there is growing evidence that the EU’s CBAM, which allows domestic carbon costs to be deducted from the border charge, is encouraging the proliferation of carbon pricing systems, particularly in countries with significant exports to the EU;
Incentivising the use of domestic technologies and co-investment in projects located abroad – e.g., Germany’s export credit agency, Euler Hermes, provided investment into project NEOM, the world’s largest green ammonia project, supporting the deployment of Thyssenkrupp Nucera’s electrolysis technology;
Enabling technology transfer to national companies – e.g., China has long conditioned market access in strategic sectors to co-investment with Chinese firms through joint ventures;
Shaping the technical specifications of key commodities – e.g., sustainability requirements in the ReFuelEU regulations are shaping feedstock sourcing for sustainable fuels across the globe.
A tipping point is the moment when reinforcing feedback loops, such as cost declines, market uptake, policy support and infrastructure buildout, combine to make a technology’s widespread adoption rapid and selfsustaining. It usually occurs when clean technologies reach 5–10% of market penetration.
If the 15 biggest buyers of fuels, chemicals and materials globally were to simultaneously stimulate demand for low-carbon commodities (whether or not in a coordinated way), they could together scale global clean markets to sufficient volumes to unlock tipping points. The top five biggest buyers alone, which generally encompass China, Europe, US and India, could generate 80-90% of the necessary volumes. Depending on the sector, each country would need to transition between 5- 20% of its market to clean products to precipitate a global tipping point. If certain regions like China or the EU were to scale their clean demand faster, they could trigger tipping points even in the absence of progress in other geographies.

1. Tipping point volumes are defined as 5% of projected 2050 production per sector, used as an indicative threshold at which market tipping points become plausible. The top 15 markets selected for each sector are ranked based on projected 2030 consumption, filtered by a weighted feasibility score. The contribution of each country to the estimated volume required to reach a tipping point is calculated by (i) dividing its 2030 demand by the combined 2030 demand of all 15 markets to determine its share proportionally and (ii) applying this share to the estimated volume required to reach a tipping point. 2. Europe excludes Russia and Türkiye. Source: Adapted from MPP, Unleashing market forces to scale green industry The role of Green Market Makers, (Sep, 2024).
Competitive value chains combine strengths across borders
The strongest, most cost-competitive clean industrial supply chains will combine best-in-class technology and engineering expertise with abundant, cheap, clean energy and natural resources, alongside access to large and growing end markets that provide revenue certainty. These elements are rarely co-located in a single country and so cross-border commercial partnerships are set to minimise production costs for the low-carbon commodities that are the backbone of the global economy and of people’s standards of living.
Emerging global clean value chains stumble on barriers at the borders
Three structural barriers prevent clean industrial value chains from reaching their full potential:
Proactive trade partnerships accelerate win-win outcomes
In a world of fragmented trade, governments increasingly shape trade flows purposefully to serve their national interests. In emerging clean industrial value chains, depending on each country’s singular competitive advantages and strategic objectives, trade can be leveraged to improve affordability, to grow domestic industrial value creation, to boost industry champions on international markets, or to diversify supply chains and increase resilience.
New clean industrial value chains will scale through win-win trade partnerships anchored in complementary national interests. Leading governments have started looking for and nurturing these win-win opportunities. The EU-South Africa partnership is an early example and the first of the EU’s Clean Trade and Investment Partnerships (CTIPs) aiming to give the EU access to South Africa’s critical raw materials and clean energy while supporting the country’s Just Energy Transition. Further afield, the commercial case for an Australia–Korea green iron corridor, making use of Australian renewables and iron ore feeding state-of-the-art Korean steel manufacturing to export to the EU is compelling, but the policy architecture to unlock it remains incomplete.
Market forces will structure trade relationships based on inherent competitive advantages. Waiting for this to happen will affect who captures the value and how resilient resulting supply chains are. For governments, being proactive is the surest way to make clean industry a foundation of their national economic strength and resilience.
Case Study | AM Green
Pioneering new cross boarder trading relationships
Global trade will be shaped by market forces and underlying competitive advantages. But how value chains take shape, who captures value and how resilient those chains become is not predetermined.
Governments that engage proactively will help shape the markets of tomorrow. Acting now and acting deliberately is the surest way to make clean industry a foundation of long-term economic strength, competitiveness and resilience.
Five ways governments can act


Relying on imported oil and gas makes nations, businesses and citizens vulnerable to higher and more volatile energy costs. In turn increasing the risks of energy insecurity and the associated knock-on impacts that hold back economic growth, weaken supply chains and food security, ultimately undermining industrial competitiveness.
Clean industrial development offers a way to reduce that dependence and vulnerability. It lessens shock rises in the price of food, fuel and raw materials in the face of geopolitical upheavals while making a major contribution to the fight against climate change.
The sector needs trillions in investment to scale up, but that investment will drive growth while making economies more resilient and competitive. And that investment is starting to flow – more than 800 projects are in development, with 161 already financed or built. Fuels and chemicals have dominated recent investments, particularly in methanol and SAF, showing an emerging fuel supply infrastructure that can help the aviation and shipping sectors to decarbonise. Materials remain slower to progress, but aluminium already has a head start on low-carbon production while even the modest additions to clean steel and cement volumes can provide significant learning and cost reductions to accelerate future projects.
Clean industry projects offer countries with strong renewable resources across the New Industrial Sunbelt the opportunity to reduce their reliance on volatile fossil fuel imports, boost their energy security and build new, future-facing industrial capacity.
While China is powering ahead in clean industry, it is not yet as dominant
as it is in clean energy and transport. Nations that act now to commercialise clean technologies can still lock in durable advantages, improve performance, drive down costs and build export-ready industries.
But growing clean industries is not just about who has the supply side advantages – demand from the largest industrial consumers plays a huge role in how global clean supply chains develop. Because bankable demand and low-cost clean inputs, particularly renewables, rarely happen in the same place, cross-border partnerships are crucial to build scale, create jobs and cut costs.
Attracting capital into clean industrial assets can create a virtuous cycle of cost reduction and adoption. What is needed to make clean industry bankable and attract this capital is first and foremost markets for low-carbon commodities at scale. The time is now. Those that wait risk repeating past mistakes and ceding manufacturing, market share and long-term strategic control as the industry consolidates.


Appendix in full | download report
Mission Possible Partnership | MPP
Mission Possible Partnership (MPP) is an independent non-profit organisation advancing global clean industry transformation. Since 2019, we have been working with some of the most energy-intensive industries: aluminium, aviation, cement, chemicals, shipping and steel, to cut their nearly 25% of global GHG emissions.
We mobilise business, finance, government and civil society leaders to speed up the shift to clean materials, chemicals and fuels. Having charted sectoral pathways to net-zero, we continue to forge new territory, lifting the barriers to enable a critical mass of clean industrial projects to break ground by 2030.
MPP has people and partners on the ground in North America, Brazil, Europe, the Middle East, North Africa, India and Asia Pacific.
Industrial Transition Accelerator | ITA
The ITA is a global multi-stakeholder platform -managed by Mission Possible Partnership – to fast-track decarbonisation across heavy-emitting industry and transport sectors. It aims to significantly grow the pipeline of commercial-scale, clean industrial projects to reduce emissions by 2030.
Build Clean Now | BCN
Build Clean Now is a global campaign bringing together governments, companies and finance to accelerate the pace at which clean industrial projects are financed and built, year-on-year. It is led by the Industrial Transition Accelerator (ITA) and Mission Possible Partnership (MPP).
Subscribe to our newsletter
Discover how we advance clean industry transformation globally, be first to know our latest news, projects, reports and events.
Unsubscribe at any time.
"*" indicates required fields

Download
Please enter your email to download our reports
Unsubscribe at any time.
"*" indicates required fields
Download
Please enter your email to download our reports
Unsubscribe at any time.
"*" indicates required fields
Download
Please enter your email to download our reports
Unsubscribe at any time.
"*" indicates required fields
Download
Please enter your email to download our reports
Unsubscribe at any time.
"*" indicates required fields
Download
Please enter your email to download our reports
Unsubscribe at any time.
"*" indicates required fields
Latest
UNLOCKING PROJECTS
Solutions >